Better charts from simple questions
Stephen Turbek 9 June 2009
Selecting the wrong chart, like bad chart design, can obscure the data. Here is a simple model pick the right chart for your needs.
First, let's ask a few questions to make sure we are going in the right direction.
Is a human making the chart?
If a person is creating a chart, they can decide the most appropriate format, and more importantly, highlight the interesting data. Charts generated by automatic systems must be conservatively designed, as their output is unknown. Programmers love Pie charts because the size won't change and muck up the layout.
Who is the audience?
Knowing the audience is essential for a successful communication through visuals. Assuming the viewer understands the context (e.g. remembering how many widgets we shipped each month last year) or including data the viewed is assumed to understand is a common source of confusion. Provide gentle reminders. When designing for a specialized audience, consistency with standards (for example, complex stock charts) is generally better for communication than a radical improvement.
Are you trying to illustrate a point or analyze data?
Charts are used for several reasons; confusing them leads to bad design. Chart design that works for analysis is often wrong for presentation and vice versa. Charts in a presentation are often meant not to analyze data, but simply to illustrate a point. This is the only time it is OK to use a pie chart (See below for tips on how to make them work).
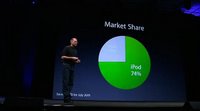
Do you even need a chart? A chart implicitly asks the audience to analyze the numbers. Often, though, you simply want to tell the number, as below


source: presentation zen
What is being decided?
Analysis charts are tools to help make a decision. "For information purposes only" usually means the designer doesn't understand the problem. A chart designer should understand the business better than the person who will be reading the chart. Each element on a dashboard, for example, should be the answer to a clearly articulated question, with defined metrics leading to specific actions. Ideally, the business needs should be so well understood that the dashboard should answer a series of yes/no questions, such as "Are our sales on target?" or "Do I need to hire more sales people?", rather than merely reporting the sales total and expecting the user to recall and compare this amount to an undefined series of others. Essentially, a dashboard should answer the question "Do I need to do something?"
Boring charts are usually the result of not having something significant to say.
What is the context of the chart?
Numbers are only interesting in comparison with other numbers. Knowing the context of the data (what the viewer wants to use it for) makes it easier to pick the right chart. Even the best chart design cannot fix an undigested data dump. Making a chart is easy; the hard part is asking the right question.
If I told you that our company shipped 50,000 widgets, it matters:
If it were this year or this month
If it last year's ship rates were 10,000 or 100,000 widgets
If our competitor's ship rates were 10,000 or 100,000 widgets
One good approach is to start by writing the question this chart is supposed to answer. The real question is not "How many widgets did we sell last month?" but "Is our new sales plan worth the investment?" As charts are there to help make comparisons, ask:
Am I comparing [something] against time, other things, or its contents?
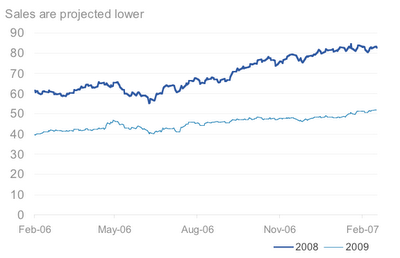
To compare against time, use a line chart
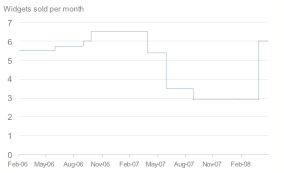
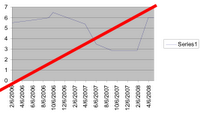
A line chart emphasized the continuum of a measurement over time, whereas a series of bars focus on the individual measurements. Time should always be shown horizontally from left to right. Use a step line chart, as angled lines suggest more data than actually exists.
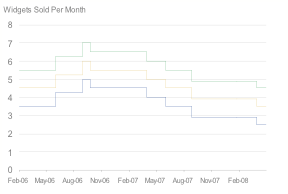
This is equally important with multiples as we want to highlight the relative changes, not the individual values.
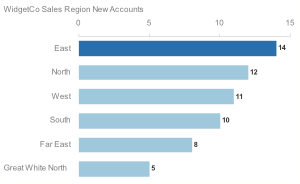
To compare items, use a horizontal bar chart
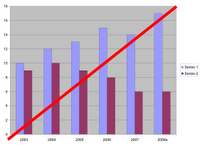
Bar charts emphasize discreteness, that the items have little influence over each other. A line chart, by comparison, emphasizes the connection.
Horizontal bar charts are the most visually effective chart.
-You don't need a "legend" or call out lines, as pie charts do.
-Text labels fit nicely into the design, saving space to make the chart larger (vertical bars rarely fit text well).
-They can be more easily read and compared to each other. The eye "tracks" (compares items) vertically more easily than horizontally.
To compare contents over time, use a stacked area chart
Stacked area charts emphasize the contents of each measurement and de-emphasize the individual values and the numbers themselves.
To compare the contents of a single item, use a horizontal bar chart
Comparing contents of an item is in fact, simply comparing the components to each other, something our old friend the horizontal bar chart is good at.
The allure of the pie chart remains strong. It makes sense to people to show "parts of a hole" as a pie chart. Programmers also like it because the overall size of the chart does not change, making designing a screen simpler.
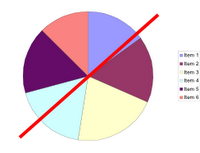
But Pie charts are very poor at helping the viewer compare amounts. For example: In the example above right, how different are items 2 & 5? Depending on data labels to explain the chart raises the question of why the chart is there at all. That said, pie charts have their uses, see below for ways to make pie charts work.
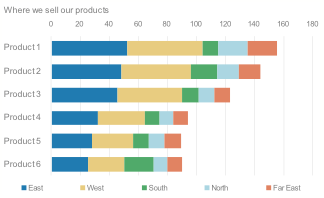
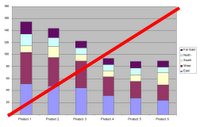
To compare the contents of several items, use a stacked horizontal bar chart
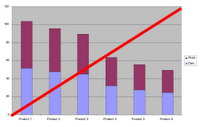
Stacked bar charts are one of the most useful charts for analyzing complex contents of multiple items. If the number of items or contents gets above 10, consider breaking it into multiple analyses.
How to use pie charts
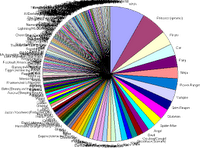
Graphic designers know to disdain the pie chart. They are rightly afraid that the result will look like this:
Source: http://brandon.ikevin.net/costume/
This pie chart does not help the reader compare the items and analyze the context.
-It is difficult to compare slices in a pie chart.
-Too many items make it unreadable.
The bar chart is a better for analysis, but pie charts are great communicators of simple messages, which is often what people want them for. They can be ok, as long as you control the data and the display
source: apple computer
Some tips
Tell the story in the title
A caption is worth a thousand pictures. Presentations documents are distributed outside of a presentation, which loses much of the context. Better than a title is the one-phrase summary that a person should walk away with. In the above example, the caption could read "iPods Market Share Continues to Increase".
Resist the urge to zoom into the action Show charts with axes that go to 0. A common mistake in stock charts, this over-emphasizes changes. Sometimes I wonder if this is intentional, perhaps making for more "exciting" visuals.
Highlight the main figure and diminish the others with color.
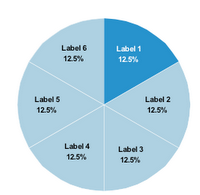
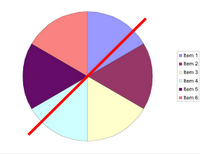
Don't display more than six items in a pie chart. If you have more items, you should be using a bar chart.
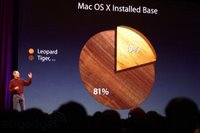
To make a point obvious, compare only 2 values. Collapsing the many "long tail" (1% - 10%) values into an "others" category reduces visual noise. You can even collapse the majority into an "other" in comparison to the highlighted value, as shown below.
source: apple computer
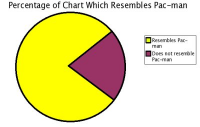
You want your chart to look as much like Pac-man as possible.
via http://www.boingboing.net/2006/11/02/hilarious-piechartvi.html
Specialty charts
Stock Charts
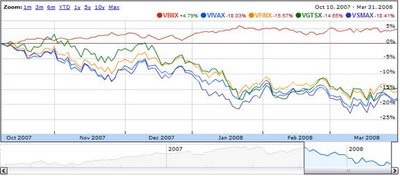
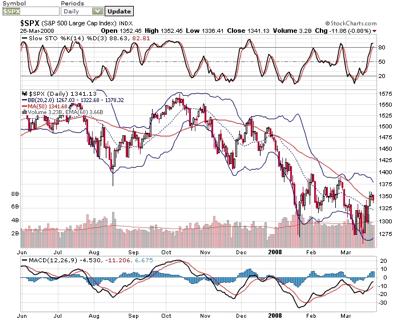
Different audiences require different charts. New investors expect a stock chart to reflect numbers they understand, for example, a stock price. They can be confused when the Y axis is logarithmic (a better measurement of change, used by more sophisticated investors), and make incorrect assumptions as to how much the stock is going up or down.
The default view of a chart should reflect the audience. Google finance has a simpler chart, aimed at a general audience. A professional trader will want (and take the time to learn about) the additional information.
Source: google finance
Source: http://stockcharts.com/
To compare items over 2 measurements, use a Scatter plot
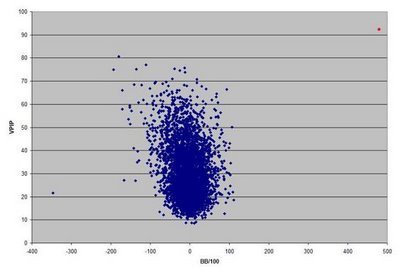
Scatter plot charts show items measured across two dimensions making connections visible.
Here is a (not beautiful) chart that clearly highlights an abnormal result in the upper right (in this case a player who was cheating in a poker tournament). The chart compares how often the person bet (Y Axis) to how often they won (X Axis).
Source: http://simplecomplexity.net/2008/02/29/catching-an-online-poker-cheater-with-data-mining/
Note that scatter plots are more sophisticated, so annotation and highlighting of interesting data is very important. The above chart clearly needs well labeled axes, the red dot made more visible, and a title.
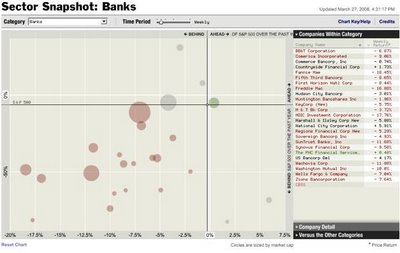
To compare items over 3 measurements, use a Bubble plot
A bubble diagram is a scatter plot with a 3rd dimension of data shown as the size of the bubble. Though beloved in the sciences and finance, it does require some explanation to the average audience.
The New York Times stock performance chart. Source: http://www.nytimes.com/pages/business/index.html
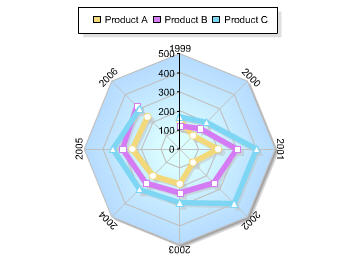
Do not use Radar charts. These are sometimes recommended for cyclical data sets, such as months per year. Use overlayed line charts instead.
Source www.perceptualedge.com/blog/?p=118
I'd like to thank Vlad Jenkins & John Daschbach for inspiring design ideas.
